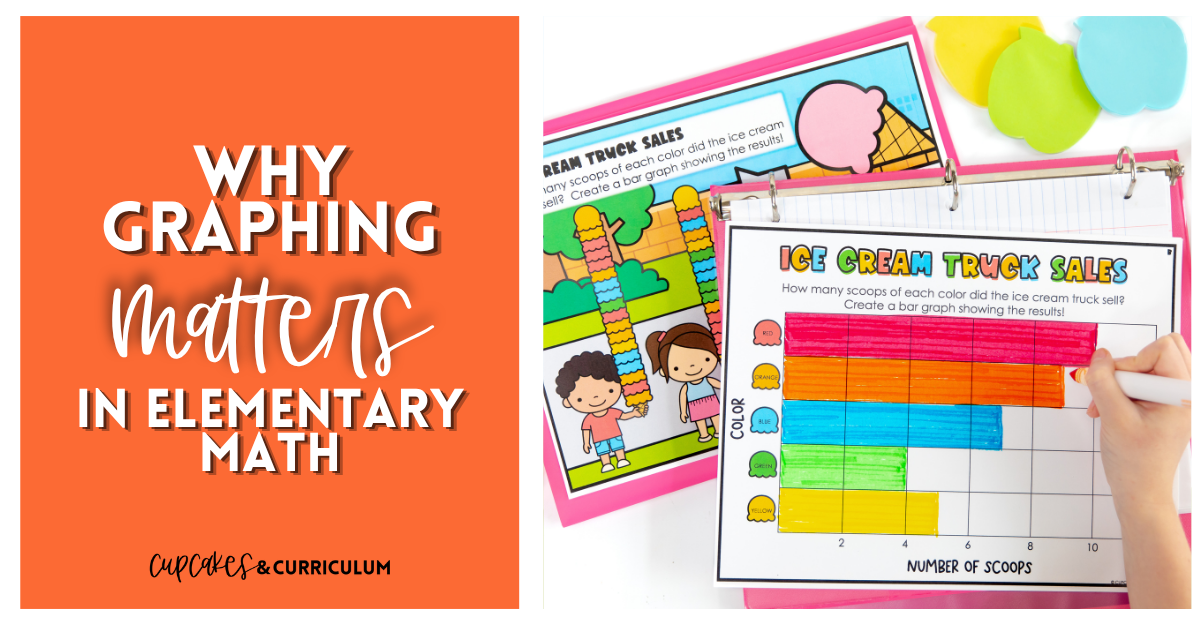
Graphing is data literacy in disguise. The skill teachers are actually building, year after year, is the ability to read information, draw conclusions, and explain those conclusions to someone else. That’s a skill students will use long after they leave your classroom.
Graphing also threads through almost every other math strand. Counting in kindergarten. Addition and subtraction in 1st and 2nd. Multiplication in 3rd, when scaled bar graphs ask kids to multiply by 2s, 5s, and 10s without anyone telling them they’re multiplying. Fractions in 4th, when line plots use halves, quarters, and eighths. A student who can graph well is often quietly stronger in the strands graphing borrows from.
The flip side is that graphing is also where struggling students get exposed. A kid who can fake counting on their fingers cannot fake reading a bar chart. So if you teach graphing well, you also catch the gaps. For more on supporting students who need extra help in math, my post on helping the student who struggles in math walks through the moves I make for kids who need a different approach.
Graphing builds in a clear progression from kindergarten through 4th grade. Each year adds a layer, and skipping a layer almost always shows up as a gap a year or two later. Here’s what students should be learning at each stage, what trips them up, and where to start.
What students learn: Sort objects into categories, count how many are in each category, and compare which category has more or fewer.
Where to start: Real objects, not paper. Give kindergartners a pile of buttons, blocks, or counting bears and ask them to sort by color. Then count each pile. That’s a graph, you just haven’t drawn it yet.
Common pitfall: Jumping to a paper graph before students have physically sorted things. Without that hands-on step, the bar chart on the page doesn’t connect to anything real.
Try this: Have students vote with their bodies. “Who likes cats best? Stand on the rug. Who likes dogs best? Stand by the window.” Count each group out loud. Now your students ARE the graph. The next day, do the same vote on paper.
What students learn: Organize, represent, and interpret data with up to three categories. Answer questions about how many in each category, and how many more or less in one compared to another.
Where to start: Tally charts. They are the bridge between counting and graphing. Students can see the data accumulate as they tally, then count the total at the end.
Common pitfall: Asking 1st graders to read a graph before they’ve made one. Always have them build a graph first using their own data before you ask them to interpret a graph someone else made. This was the single biggest shift in how I taught graphing in 1st, and it changed everything.
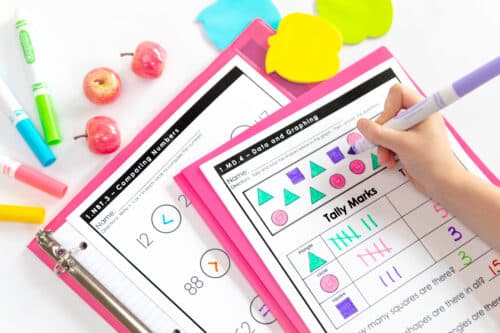
Try this: Take a class survey (“What’s your favorite recess game?”) and have students each add a tally mark to the chart. Then turn that tally chart into a bar graph together on the next page. Now they have seen the same data three ways: votes, tallies, bars. It clicks.
Resource for this grade level: My Data and Graphing worksheets for 1st grade math cover all of 1.MD.4 with both printable and digital versions. The 1st grade digital graphing activities work for SeeSaw or Google Classroom if you’re going paperless.
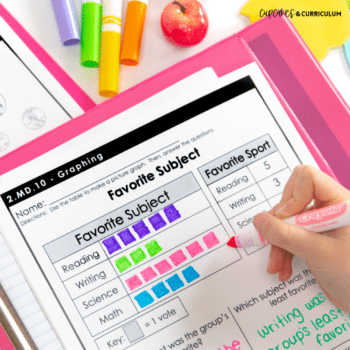
What students learn: Draw a picture graph and a bar graph (with single-unit scale) to represent a data set with up to four categories. Solve simple put-together, take-apart, and compare problems using information from the graph.
Where to start: Picture graphs first. The 1-to-1 correspondence (one picture equals one thing) is concrete in a way bar graphs aren’t. Once students are comfortable, move to bar graphs.
Common pitfall: Letting students get away with “more” and “less” when the question asks “how many more.” 2nd graders need to do the actual subtraction, not just identify the bigger bar. This is where graphing meets word problem comprehension, and it’s where a lot of kids quietly fall behind.
Try this: Give pairs of students a picture graph and ask them to write three questions about it for another pair to answer. Writing the question forces them to think about what data the graph shows, which is harder than answering questions about it.
Resource for this grade level: My Picture Graphs and Bar Graphs worksheets for 2nd grade math align to 2.MD.10 and cover both interpreting graphs and creating them from data.
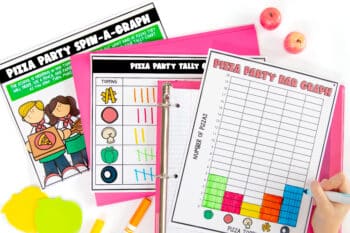
What students learn: Draw a scaled picture graph and scaled bar graph. Solve one- and two-step “how many more” and “how many less” problems using information from the graphs.
Where to start: The scale. This is the leap from 2nd grade and it’s a big one. A single picture or bar now represents 2, 5, or 10 things instead of just 1. Spend a whole lesson on the concept of “what does one square mean on this graph?” before you ask students to read or build one. I cannot tell you how many times I rushed this in 3rd and paid for it the next week.
Common pitfall: Students count squares instead of multiplying. They see a bar with 4 squares and write “4,” missing that each square represents 5. This is why 3rd grade graphing is so closely tied to multiplication, and why a kid who’s shaky on multiplication often crashes on scaled bar graphs.
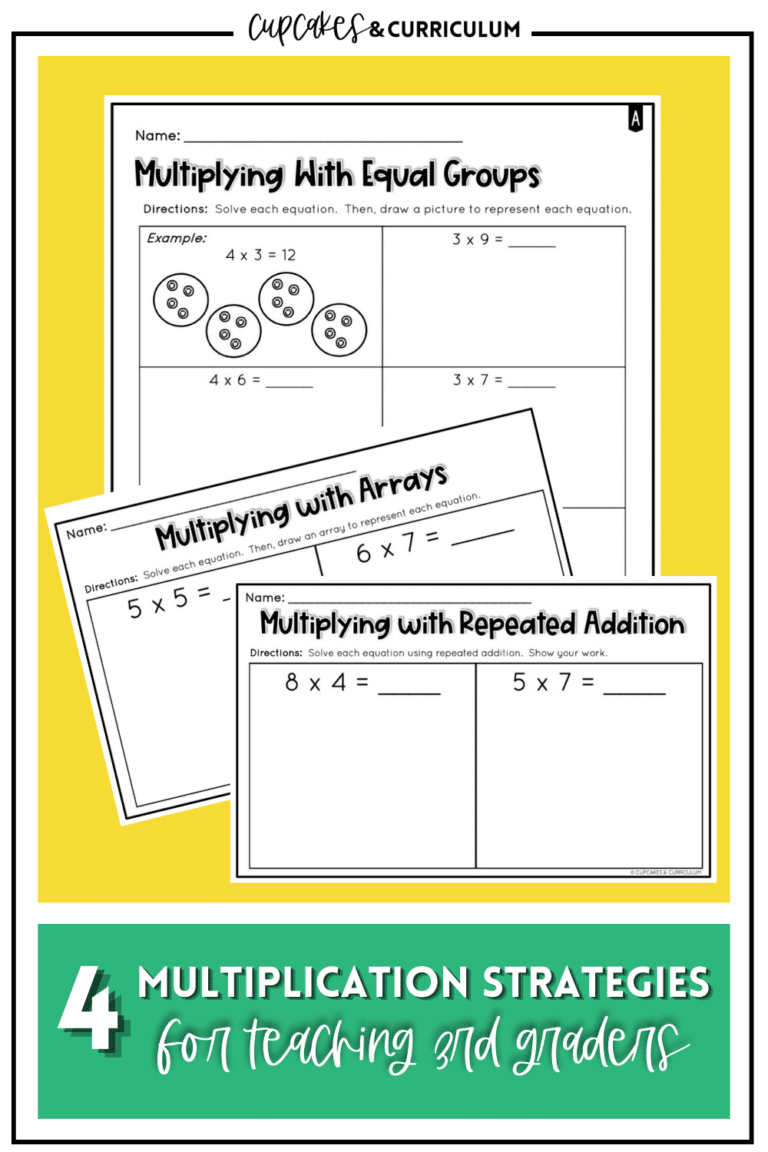
Try this: When you introduce a scaled graph, cover the data and ask students to predict what the scale should be. “If we surveyed 100 people, would each square equal 1? Why not?” Get them thinking about scale as a problem-solving choice, not a rule someone made up. For more on the multiplication piece, my post on multiplication strategies for 3rd graders covers the foundation skills graphing relies on.
Resource for this grade level: My Picture Graphs and Bar Graphs worksheets for 3rd grade math cover 3.MD.3 with print and digital options. If you want hands-on practice too, the Graphing and Data Math Centers for 3rd grade include themed centers and task cards that work for stations or fast-finishers.
What students learn: Make a line plot to display a data set of measurements in fractions of a unit (halves, quarters, eighths). Solve problems involving addition and subtraction of fractions using the line plot.
Where to start: Measurement. Line plots in 4th grade are almost always built from measurement data, and your students need to be solid on fractional inches before the line plot makes sense. If they cannot measure to the nearest quarter inch, the line plot is going to feel impossible.
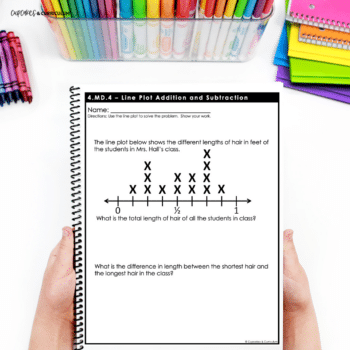
Common pitfall: Line plot vs. bar graph confusion. Students treat the X marks like bars and try to “read” the height. Make sure they understand each X is one data point, and the line plot is a count of how many measurements fell at each value.
Try this: Have students each measure something in the room (a pencil, a book, their shoe) to the nearest quarter inch. Collect every measurement on the board. Build the line plot together as a class. Now ask, “What’s the difference between the longest and the shortest?” That’s a fraction subtraction problem in disguise, which is exactly what 4.MD.4 wants.
Resource for this grade level: My Line Plot and Fraction Addition/Subtraction worksheets for 4th grade math align to 4.MD.4 and combine line plot interpretation with fraction operations, which is the way the standard is actually tested. For more on the fraction skills underneath, see my post on fourth grade fractions and decimals.
The grade-level moves above matter, but a few broader principles apply across the elementary years. These are the tips that made the biggest difference for me.
1. Use real classroom data whenever possible. Eye color, favorite lunch, number of pets, recess game preferences. When the data is about them, students engage more, retain more, and ask better questions. A graph about generic “Class A vs. Class B test scores” is forgettable. A graph about how many of your kids have a dog versus a cat is not.
2. Teach the question before you teach the graph. Before any graphing activity, ask students “What are we trying to find out?” Graphs are tools to answer questions. If students don’t know the question, the graph is just a coloring activity.
3. Have students build graphs before they read graphs. Always. Even in 4th grade. The act of building a graph from raw data teaches what the graph is doing in a way that interpreting a finished graph never quite does.
4. Connect graphing to your current math unit. If you’re teaching multiplication, build a scaled bar graph using multiplication facts. If you’re teaching fractions, do a line plot with fractional measurements. Graphing doesn’t have to be its own isolated unit. It can be the application piece for whatever else you’re already teaching, which is honestly so much easier than treating it as one more thing on the pacing guide!
5. Don’t skip the questions students ask. When a student asks “Why does this bar look bigger than that one even though they’re the same number?” or “What if we counted the boys and girls separately?”, that IS the lesson. Follow those questions instead of pulling them back to the worksheet. Real data analysis happens in those moments.
Each grade-level section above links directly to the matching resource for that standard, so you can grab what fits the grade you teach without scrolling through products that don’t apply. If you’d rather browse the full collection, my graphing and data resources on TpT are organized by grade and Common Core standard.
For a complete year of math practice that covers graphing alongside every other Common Core domain, my K-5 math skill checks for the entire year bundle gives you weekly practice you can drop into any pacing guide.
Graphing is one of the few skills in elementary math that builds visibly, year after year, in a way both you and your students can see. The kindergartner sorting blocks today is the 4th grader interpreting a line plot four years from now, and the moves you make at each grade level shape what’s possible at the next.
If you’re mapping out your math year, pick the grade-level section above that fits your classroom and start there. The progression takes care of itself if the foundation is solid!