Whether you’re a teacher or a parent, incorporating fun and interactive activities for graphing will help your students or children explore and understand data. By using graphs, they can visually represent information and draw conclusions.
Through hands-on activities and colorful visuals, graphing empowers young learners to analyze data, make predictions, and develop critical thinking skills.
Because these skills lay such a strong foundation for your students’ academic future, I have compiled a list of prepped-for-you, educator-favorite resources that you’re sure to LOVE!
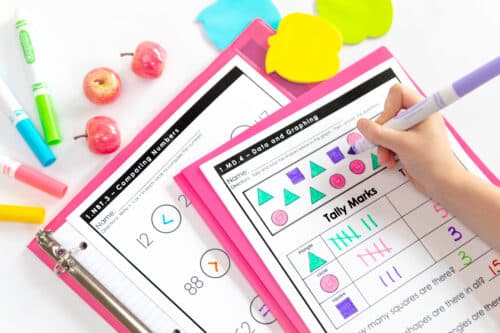
Common Core aligned, this first grademath resource includes printable and digital worksheets that give your first graders practice with simple graphs and their data. The quick checks are perfect for review, fast-finisher activities, and exit tickets.
Take a peek at what’s included:
4 pages asking students to analyze data from a bar graph
2 pages asking students to analyze data from a tally chart
2 pages asking students to create a tally chart and answer questions when given a data set
2 pages asking students to create a data set, then make a tally chart and a bar graph using that data
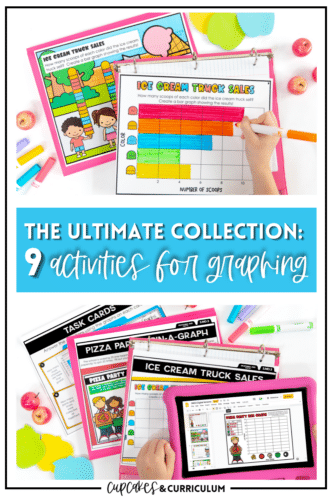
From morning work and assessments to centers and homework, this second grade math resource includes both printable and digital activities that gives your students practice with simple graphs and their data.
A quick view of what’s included:
3 pages – answer questions based on bar graph data
2 pages – answer questions based on picture graph data
2 pages – make bar graph based on data and answer questions
3 pages – make picture graph based on data and answer questions
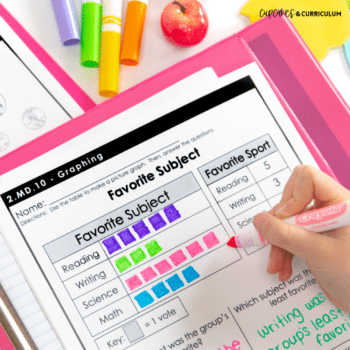
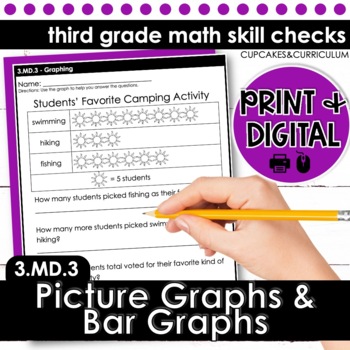
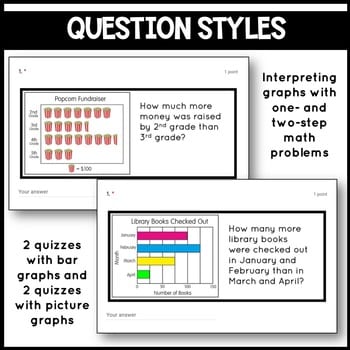
Available in both printable and digital worksheets, these Common Core quick checks give your third graders practice interpreting and creating bar graphs and picture graphs. Use them for morning work, homework, assessments, review, on in centers – these are a perfect resource to have on hand!
A glance at what’s included:
2 pages – create a picture graph when given data
2 pages – interpret information from a picture graph
2 pages – make a bar graph when given picture graph
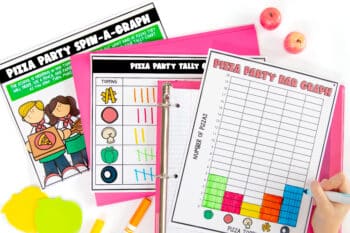
Fun and engaging math centers that can be used year-round, this resource includes both the printable and digital option that will give your third graders practice creating bar graphs and interpreting data from graphs!
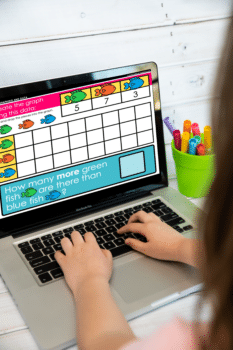
Designed for you to be able to quickly see where your students are in their mastery, this interactive set of digital activities gives your first grade studentspractice in analyzing simple graphs and sets of data.
What’s unique about this resource:
3 formats – giving you options based on your current teaching assignment and digital learning platforms. Even if your digital learning platform changes, you will still be able to utilize this resource!
Each activity is only 5 pages/slides, giving you a QUICK assessment of student understanding
Engage your students in paperless practice, solving put together and take away problems based on data from picture graphs and bar graphs.
Bonus: Using Google Forms and this resource, you will be able to quickly assess student understanding, helping you identify which students may need more assistance as well as helping you to drive your instruction, accordingly.
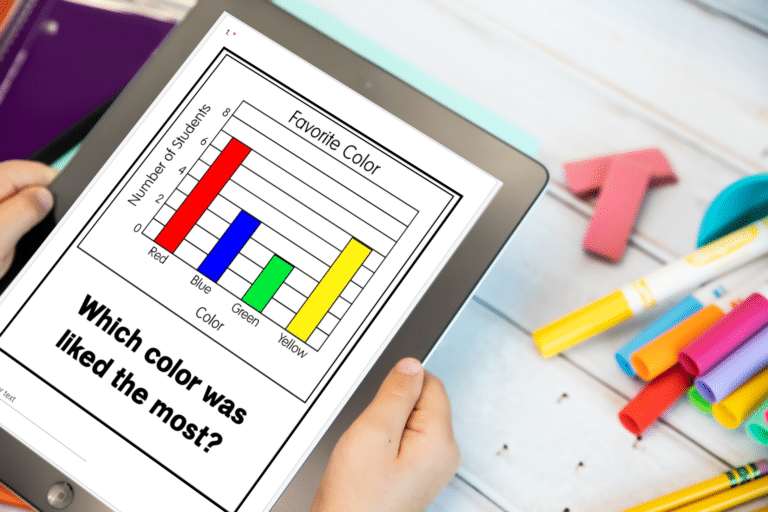
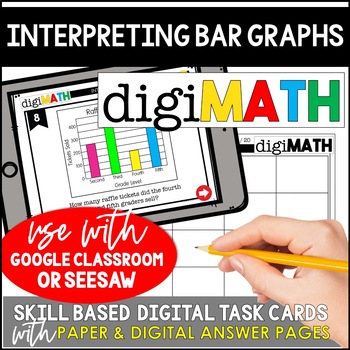
Do your students need to practice interpreting bar graphs?
Math task cards made easy – take most of the prep work OUT of independent math tasks with digiMATH!
DigiMATH allows you to save time and resources, while having your students access targeted math skill practice via their device.
Bonus: Students will view problems on their device and record their answers then they will self-check their OWN work – holding them accountable and giving you the assessment info you need!
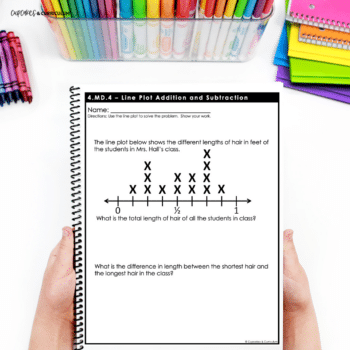
A Common Core aligned quick check for your fourth grade students, this math resource includes printable and digital worksheets that have your students practicing with line plots and their data.
What makes these math quick checks better?
Check for student understanding of a single skill in multiple ways
Student centered design with easy-to-read fonts and minimal clipart
Aligned with Common Core, but skill based to give you the ability to apply to any set of standards
Print and digital formats to seamlessly adapt to your current learning environment